EDA part 2: Learning about Estimates of Location
What is the mean and median, and why do we care?


This is the second article in a series on EDA. What is EDA? For an overview of Exploratory Data Analysis see my last article.
Getting estimates of location
In this article I'm going to go over some specific ways we can measure data to gain more generalized information from it. We'll be talking about numerical data exclusively. We'll look at some ways to see patterns in our data, rather than a jumble of numbers. We'll use math to generalize the numerical data.
As such this article will contain some equations, but fear not! I will explain each piece of the math so you can understand what the fancy math symbols are trying to tell you. I'll also provide some code examples for you to see a working example of what the equation is doing.
Motivation
So you've got a bunch of data in your dataset. You look at the items in your dataset.
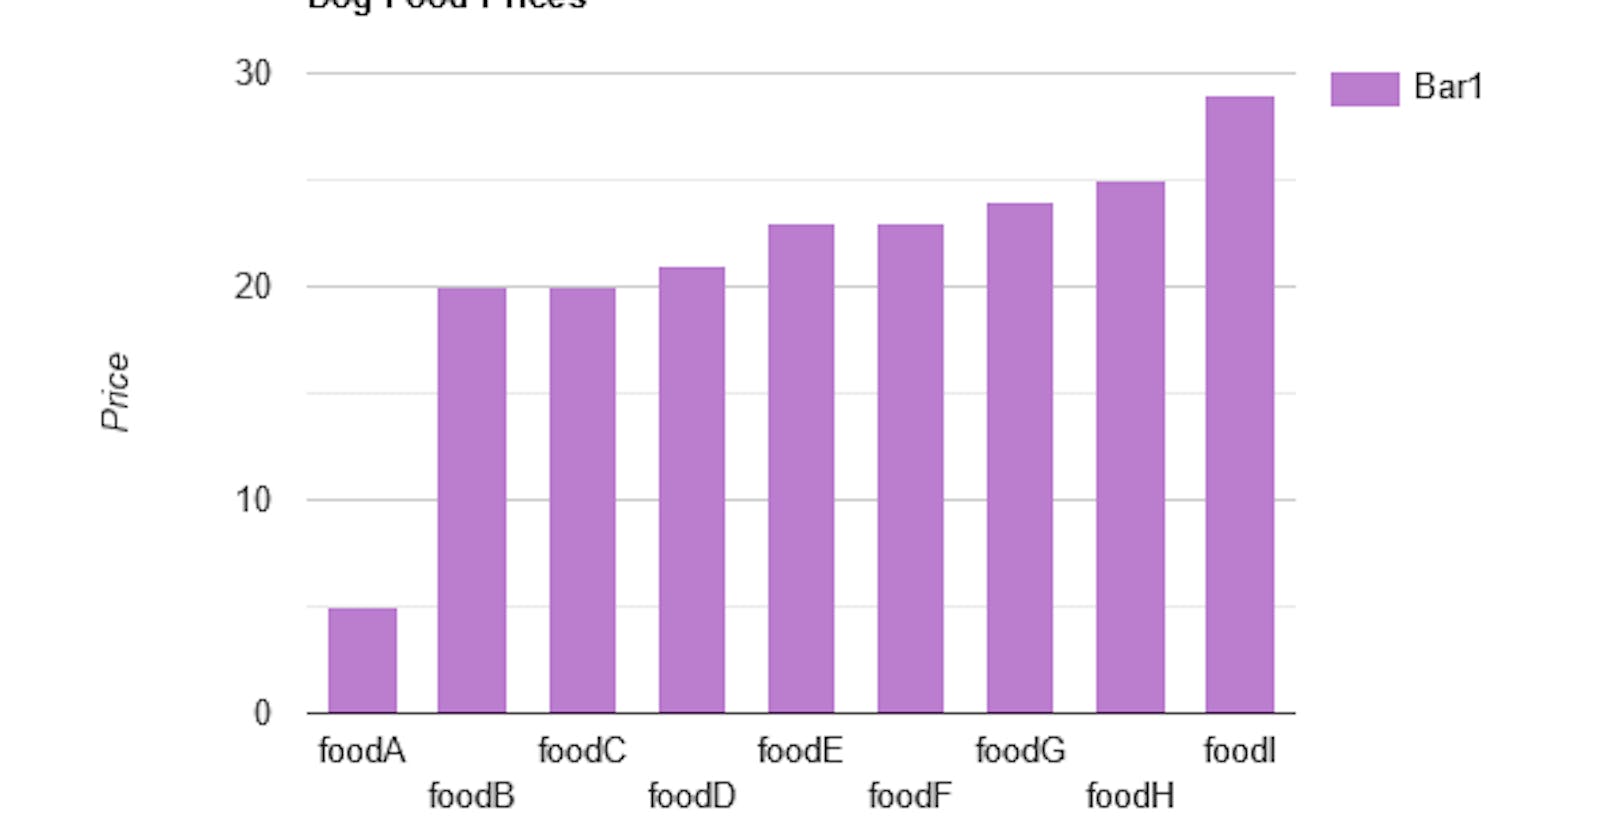
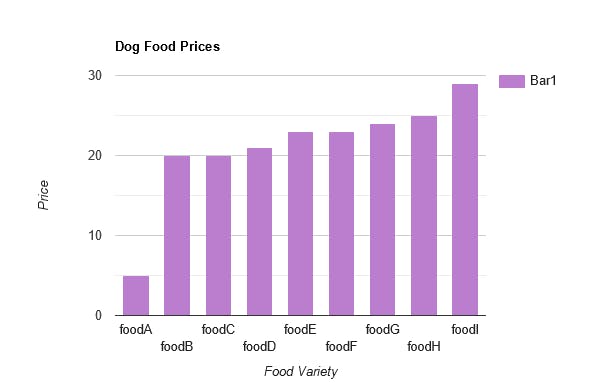
Let's imagine we have a dataset of dog food varieties and we're looking at a column in our dataset for prices. Dog food A costs $5, Dog food B costs $20, Dog food C also costs $20...etc all the way to Dog food n which costs $29 (n in math just refers to whatever number is the last in a sequence - if there are 9 types of dog food then n = 9).
Each item in the dog food price column has a different value. How does knowing the prices of each dog food variety help you understand the dataset as a whole? Well it doesn't, really. When your variables are made up of measured data the data itself can have any number of different values. Looking at each of these values individually will take a lot of time, especially when you have more than nine varieties of dog food. It's also hard to keep all those values in your working memory so that you can recognize patterns.
For any given variable we are interested in exploring (which is the column of a dataset), we need a way to summarize all those different numerical values.
Here’s an example: Instead of looking at each price of dog food one at a time let’s find a way to at a glance see how much dog food costs in general (or, you know, on average, wink, wink)
This is called summary statistical analysis. We are finding an estimate of location.
What's location?
This is an estimate of where most of the data falls and it is sometimes called the central value/tendency in Statistics.
We can make a bar graph to visualize where most of our dog food prices fall. We can see they're around $20-22 per bag. We can also see that this one fluke price of $5 is way off from the rest of the data (we'll come back to that later in the article).
The Mean
In addition to looking at a graph, we can find an actual value to represent the data's central tendency. One such value is the mean, although you might know it as it's other common name, the average.
To get the mean for a column in your dataset, you add all the values in the column together and then divide that resulting sum by the number of members in that column.
Here's the fancy equation:
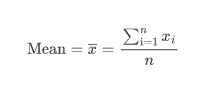
mean = x-bar = Σn i=1 xi / n
What does this all … ahem…mean?
- The x with the line over it is pronounced "x bar" and is used to talk about the mean of a sample from a population. It's the value we're looking for.
- The big Greek letter sigma (Σ) may look intimidating, but it is an abbreviation for “sum”. It tells us we are adding together a bunch of values
- The i=1 subscript on the Sigma tells us that we are going to do this for each of the values in our column, starting with the first, x1 all the way to xn (n means however many values you have in your dataset, that is the final one).
- Divided by n - again, n just means the number of all the values in the dataset. In our example the nth item is Dog food I, which is $29
So we'll write this equation out for our dog food price example:
mean dog food price = (5 + 20 + 20 + 21 + 23 + 23 + 24 + 25 + 29) / 9
Let’s write that in Python:
dog_food_prices = [5, 20, 20, 21, 23, 23, 24, 25, 29]

def get_mean_price(dog_food_prices):
    mean = round(sum(dog_food_prices) / len(dog_food_prices))
    return mean
What does this code do?
- first we put the numbers of all the dog food prices into a list
- we write a function
def_mean_pricewho's job is to calculate the mean dog food price - we put the
dog_food_priceslist as a parameter into our function - then we add all those numbers from that list together using the
summethod built into Python - we divide the value returned by
sumby the length of dog_food_prices - in other words we divide the sum by how many different kinds of dog food there are - then
roundjust rounds off our answer to 2 decimal places so that it doesn't have a ridiculous number of decimal places trailing off into the aether... - we save all that stuff to a variable called
mean - and we return the result
mean
Quick definitions
What is a sample? A sample is a part or subset of a population. In our example the sample is the 9 dog food varieties we are looking at.
What is a population? A population is the whole of the group of things or people being studied. In our example the population would be all dog food.
Variations on the mean
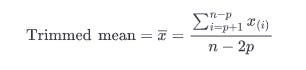
- Trimmed mean (sometimes called the truncated mean or average): the trimmed mean is the same as the mean except you’re going to remove outliers. This means that the lowest and highest values will be trimmed from the dataset before adding together all your values and calculating the mean. It helps normalize your value, so your mean isn’t skewed by extreme high or extreme low values (Like the fluke $5 bag of dog food).
Here's how we'd change the code to find the trimmed mean instead of the mean.
dog_food_prices = [5, 20, 20, 21, 23, 23, 24, 25, 29]

dog_food_prices.remove(min(dog_food_prices))
dog_food_prices.remove(max(dog_food_prices))

def get_trimmed_mean(dog_food_prices):
    mean = round(sum(dog_food_prices) / len(dog_food_prices))
    return mean
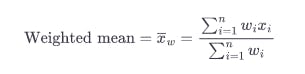
- Weighted mean (weighted average): is similar to the mean, except before adding all the values together you’re going to multiply each one by a set weight (w) which helps to balance out the values a little
Median
To get the median you sort the data and then take the middle value. If there are an even number of values, then take the two middle values and get their mean to find your median value. Since the median depends only on the values in the center of the data, it is already protected from the scary influence of outliers.
In Python this would look like:
dog_food_prices = [5, 20, 20, 21, 23, 23, 24, 25, 29]
dog_food_prices = sorted(dog_food_prices)

def find_median(prices):
  length = len(prices)
  if length/2:
    return (prices[int(length/2-1)]+prices[int(length/2)])/2.0
  else:
    return prices[int((length/2-1)/2)]

print(find_median(dog_food_prices))
Variation on the median
Weighted median: similar to the weighted mean, the weighted median is the same as the median except each value is first multiplied by a weight that you choose
Some more terms
Robust: robust means that the measure is not easily influenced by outliers
Outlier: an outlier is an extreme value. It can be either at the lower end or upper end of the values. E.g. using the example of dog food prices from earlier, let’s say we have a bag of dog food that costs only $5. Since the other bags cost around $20 to $22 per bag this value would be considered an outlier because it is so different from the others. You can see if we take a mean of the dog food prices, we’re going to have a deceptively low average. That’s why you want to either use the median, or trim your outliers before taking the mean, to give a more accurate picture of the central value for dog food prices.
Anomaly detection: is an area where we study outliers. We want to focus on what is weird in a dataset. The weird stuff, the outliers, are the points of interest, and we compare them to the rest of the values which serve as a reference point.
Come back in 2 weeks for more on Exploratory Data Analysis! I'll be giving an overview on estimates of variability: things like standard deviation and variance.
Further reading
These articles on EDA are adapted from my notes on Practical Statistics for Data Science by Peter Bruce, et al. So far I like this book because the writing style is straightforward and concise, yet doesn't skimp on important technical terminology. I have not finished the book, but based on what I've seen so far and its reviews, it's a good one to read if you want farther information on this topic.
Here's a link to the Google books preview, if you're interested.